Data Visualization
Infographics and Data visualization in magazine spread
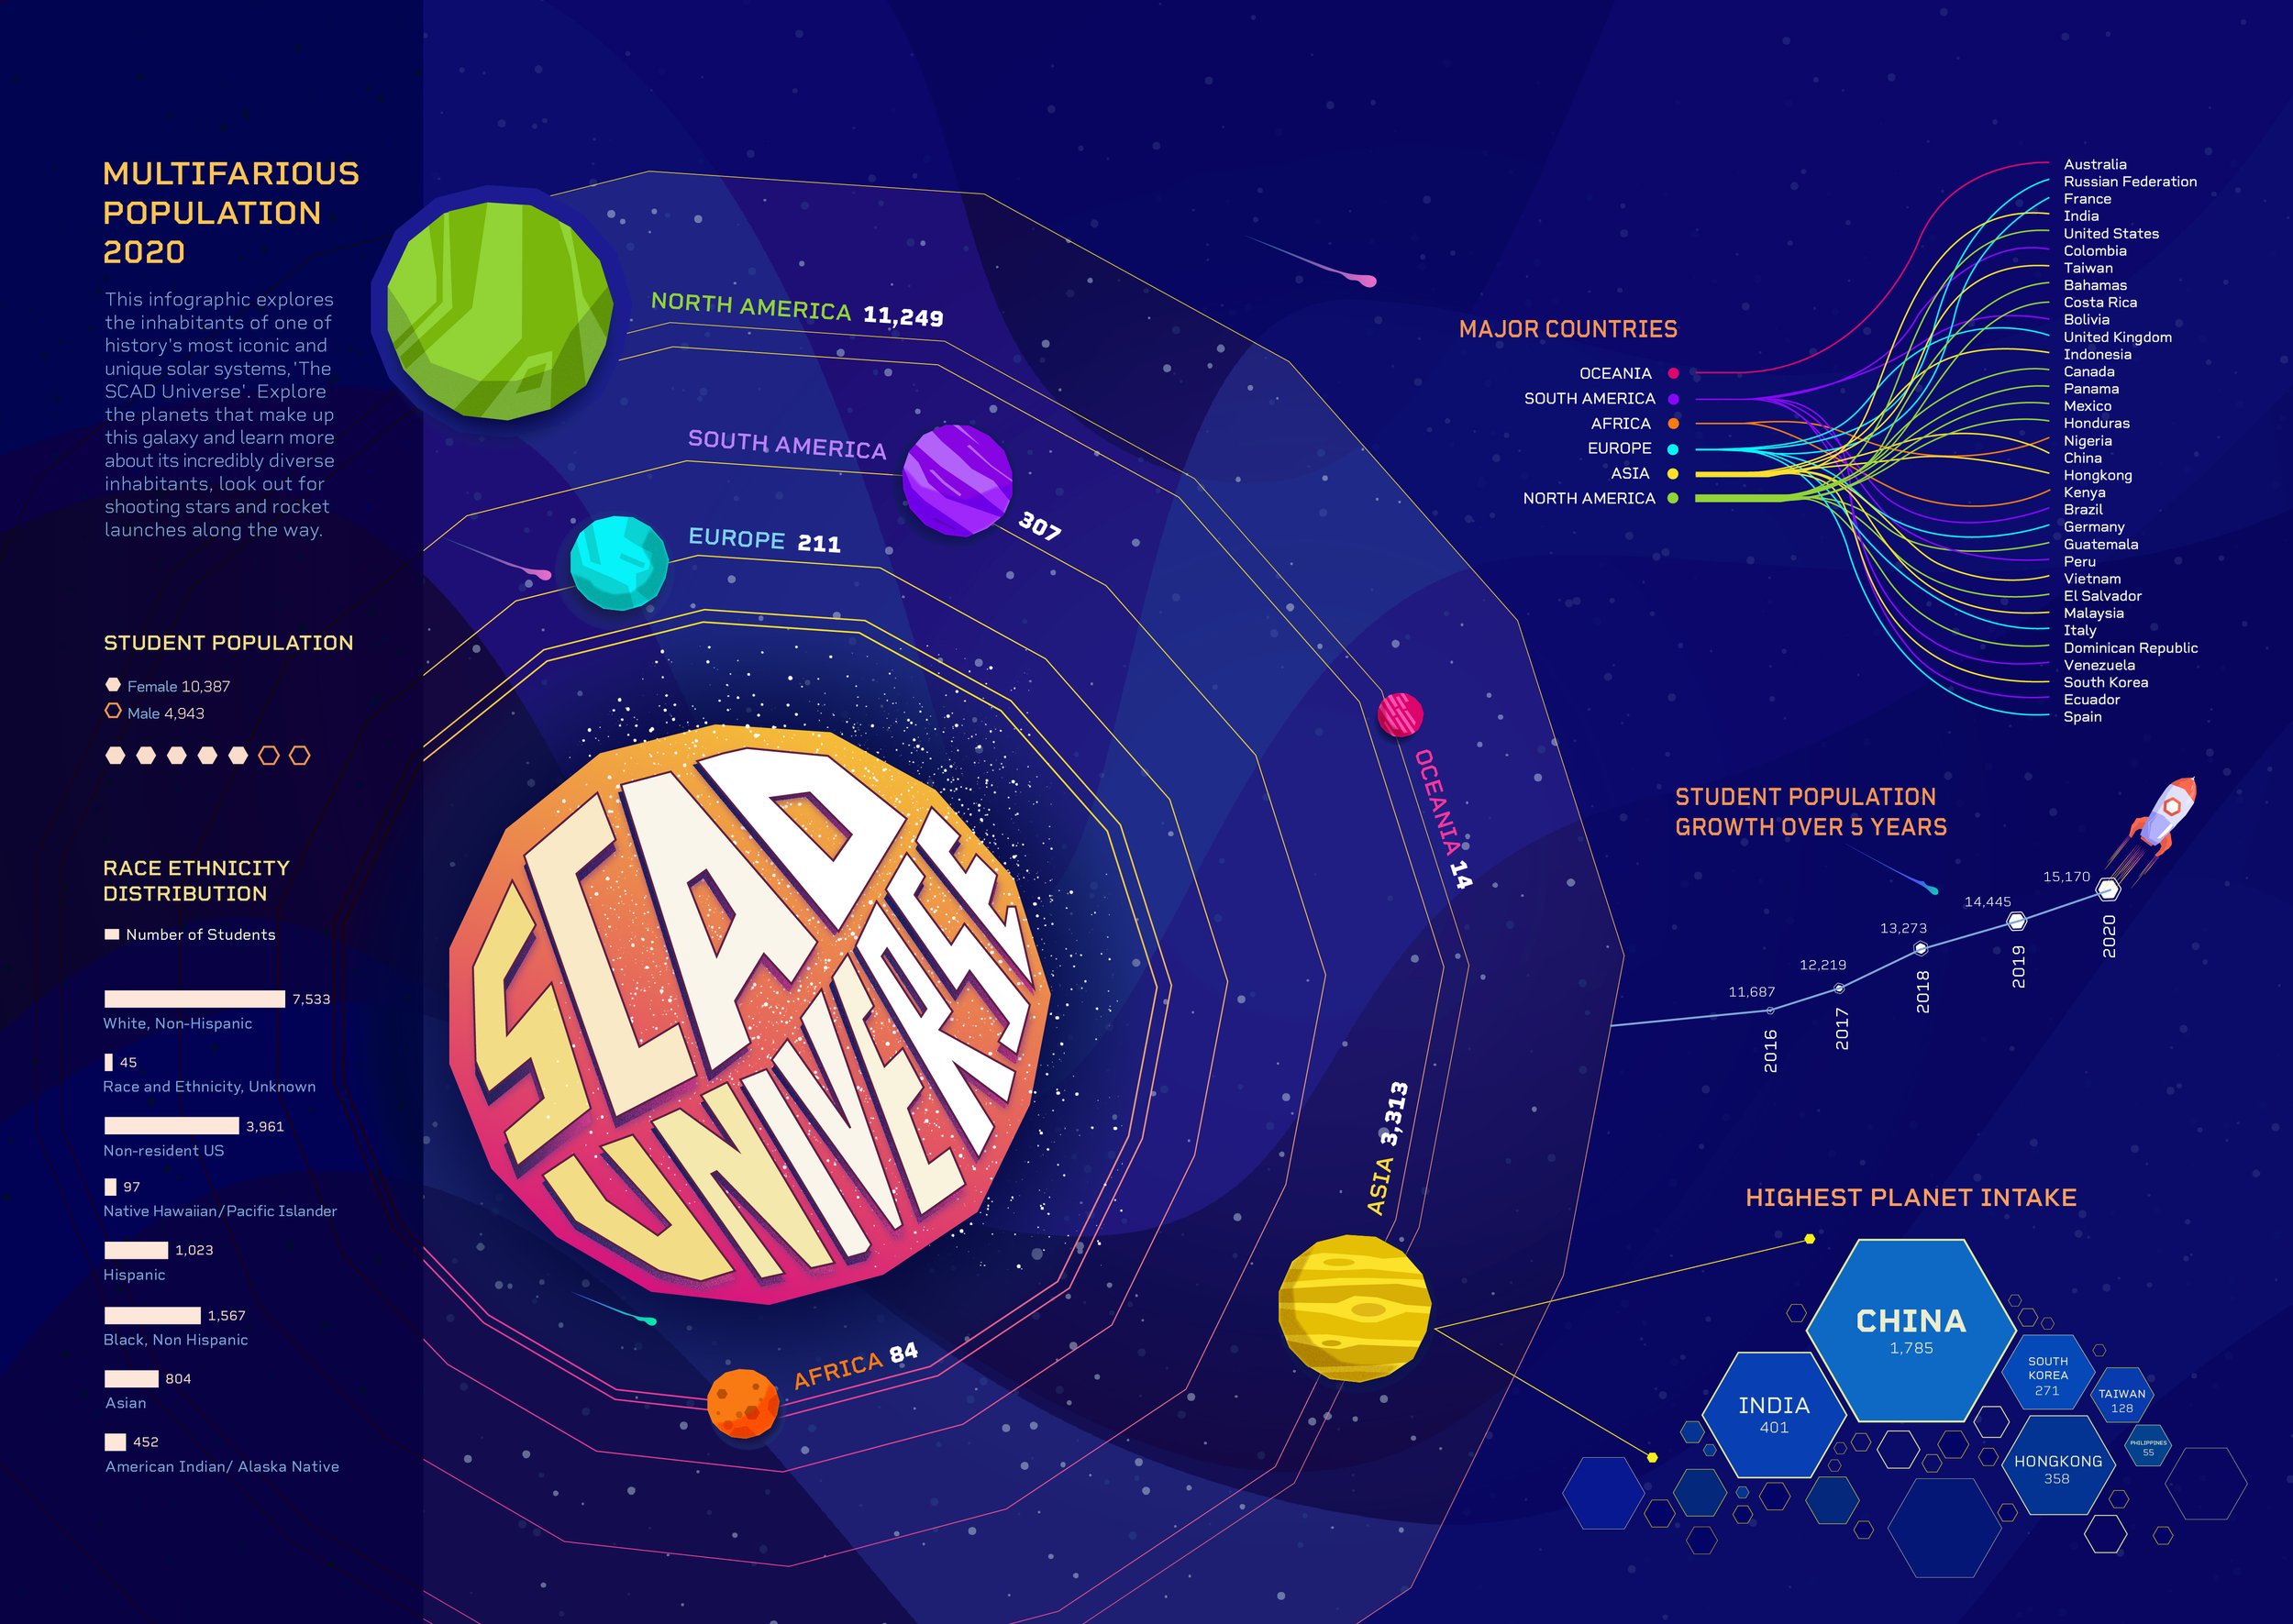
SCAD is one of a kind, out-of-this-world college. What better way to highlight SCAD'S incredibly diverse student body than through a data visualization inspired by this mindset. "SCAD Universe" infographic will showcase astonishing data through impactful and visually enticing design inspired by the outer universe and galaxies. Viewers will be transported to SCAD's very own universe. This infographic spread will be published in SCAD Academic catalog. The aim is to create an informative and fun data visualization that highlights the incredibly rich and diverse student body at SCAD.
Project Awards and features:
Design Team:
Khushboo Uday Nayak, Sonali Mestri, Matthew Payne, Sabrina hong


Our Aim and Message
“Create an informative and fun data visualization that highlights the incredibly rich and diverse student body at SCAD”.
Showcase SCAD’s Unique and ‘one of a kind’ environment


Publication
We purposely selected the SCAD Academic Catalog. All the students and parents who are considering SCAD will get an idea about how diverse SCAD is and will understand the natural strengths of SCAD. This publication is contributed to each and every student and visitor to give them an idea and information about the university and the courses and about the student’s life.


Close-up infographics
These are the close-up shots of the small infographics about the data received from the last 5-6 years, and from that, we could see the tremendous growth SCAD has developed in terms of the student population.


